How ChatGPT Helped Us Reduce Our Energy Consumption
At Greenspace, our coworking space, and the most peaceful coworking space in Paris, electricity consumption has always been a major concern. We continuously work to reduce it in order to lower our carbon footprint.
For several years, we have encouraged our coworkers, including entrepreneurs, freelancers and remote employees, to adopt more responsible habits and practise energy efficiency, such as unplugging devices when they are not in use and switching off the lights before leaving.
However, despite the efforts of the entire Greenspace community, this was not enough.
Our coworking space occupies 760 square metres in an industrial building in Paris’s 11th arrondissement. It has ceilings between four and seven metres high, polycarbonate skylights and a sawtooth roof. As a result, the building has relatively limited thermal insulation.
In summer, to keep our coworking areas comfortable despite the heat, we use eleven reversible air-conditioning units, which provide both cooling and heating and were replaced a few years ago.
In winter, in addition to these reversible air-conditioning units, which are our main source of heating, we also need to switch on thirteen electric radiators during cold spells. These radiators were recently replaced with more energy-efficient models.
Despite having installed these modern systems, the configuration of the building means that they are heavily used during cold spells and periods of extreme heat. This has a significant impact on our electricity consumption.
In 2023, we decided to take practical action and actively reduce our electricity usage by optimising the operation of these devices.
To monitor our electricity consumption accurately and take appropriate measures to reduce it, we began looking for a device that could track changes in our energy usage precisely.
After comparing the different solutions and connected devices available on the market, including Ecojoko and Voltalis, we chose Wattspirit, an eco-innovative French company, and began using its Wattspirit monitoring system on 1 April 2023.
Thanks to this system, we can measure our electricity consumption accurately and in real time.
The LoraWatt optical sensor detects the flashing green light on our electricity meter and sends the information to the Wattspirit platform through the internet-connected LoraLink device.
Since 1 April 2023, we have therefore been able to monitor our energy consumption minute by minute.
However, simply observing the data was not enough. We needed to go further and make full use of it.
While working on another data analysis project, we suddenly realised, “Eureka!”, that we already had all the tools required to implement and evaluate practical measures to reduce our electricity consumption.
More specifically, we realised that by using ChatGPT, particularly its Advanced Data Analysis feature, formerly known as Code Interpreter, we could examine the relationship between Wattspirit electricity consumption data and outdoor temperatures.
This would allow us to assess the impact of properly programming our air-conditioning system and optimise our energy management.
As the person responsible for this project, I will share my experience in this article and explain how Advanced Data Analysis helped us significantly reduce our energy consumption.
To carry out this project, I needed the following tools and data:
A ChatGPT Plus subscription to access Advanced Data Analysis.
In simple terms, this feature allows ChatGPT to run code, potentially using files uploaded by the user. You can ask ChatGPT to analyse data, create charts, edit files, perform calculations and much more.
Cost: $24 per month, approximately €22.
A Wattspirit system, including a LoraWatt optical sensor, a LoraLink repeater and the Wattspirit dashboard, to collect electricity consumption data that could be exported as a CSV file.
Purchase cost: €159.
Historical hourly outdoor temperature data for the period from 1 April, when the Wattspirit system was installed, to 24 August 2023, the final day of hot weather in Paris and also one week before I left Greenspace. I had to leave myself a little time to write the article!
The data was purchased through the Visual Crossing platform.
Cost: €0.35.
1. Assessing Our Electricity Consumption
To begin, we needed to understand our energy consumption before making any specific changes to the air-conditioning system.
For this initial assessment, we focused on June 2023.
Start date: 1 June 2023.
This marked the beginning of the warmer temperatures and therefore the increased use of air conditioning. Attendance at the coworking space was also still relatively stable. These factors helped us isolate the relationship between outdoor temperature and electricity consumption from other variables that could affect our energy usage.
End date: 1 July 2023.
This was the date on which we began adjusting the air-conditioning schedule, as explained in the following section, with the aim of reducing electricity consumption while continuing to provide our users with a cool and comfortable working environment.
A. Preparing the Data for Analysis
First, we exported all our electricity consumption data in CSV format, which can easily be done through the Wattspirit platform.
We then exported the outdoor temperature history for the same period from Visual Crossing.
Next, we performed some data cleaning. This is the process of preparing and transforming raw data so that it can be analysed, in our case using Advanced Data Analysis.
We cleaned both CSV files so that they could be merged into a single DataFrame.
A DataFrame is a two-dimensional table similar to an Excel spreadsheet, containing rows and columns, but created using the Pandas library in Python.
In our case, we needed to carry out the following transformations before the two datasets could be merged:
Standardising the date formats
The two files used different date and time formats, one based on the US format and the other on the French format.
We therefore prompted ChatGPT to modify the relevant column in each file and convert both of them into a consistent date and time format:
DD/MM/YYYY HH:MM:SS
For example:
31/03/2023 14:53:02
Calculating hourly electricity consumption
The electricity consumption dataset contained one data point for every minute of the day.
However, the outdoor temperature data was only available on an hourly basis.
We therefore asked ChatGPT to calculate the electricity consumption for each hour of the day.
Merging the two datasets
Finally, we merged the two datasets using the date and time column as the common reference.
This created a single DataFrame containing three columns:
Date and time
Electricity consumption in kWh
Outdoor temperature in degrees Celsius
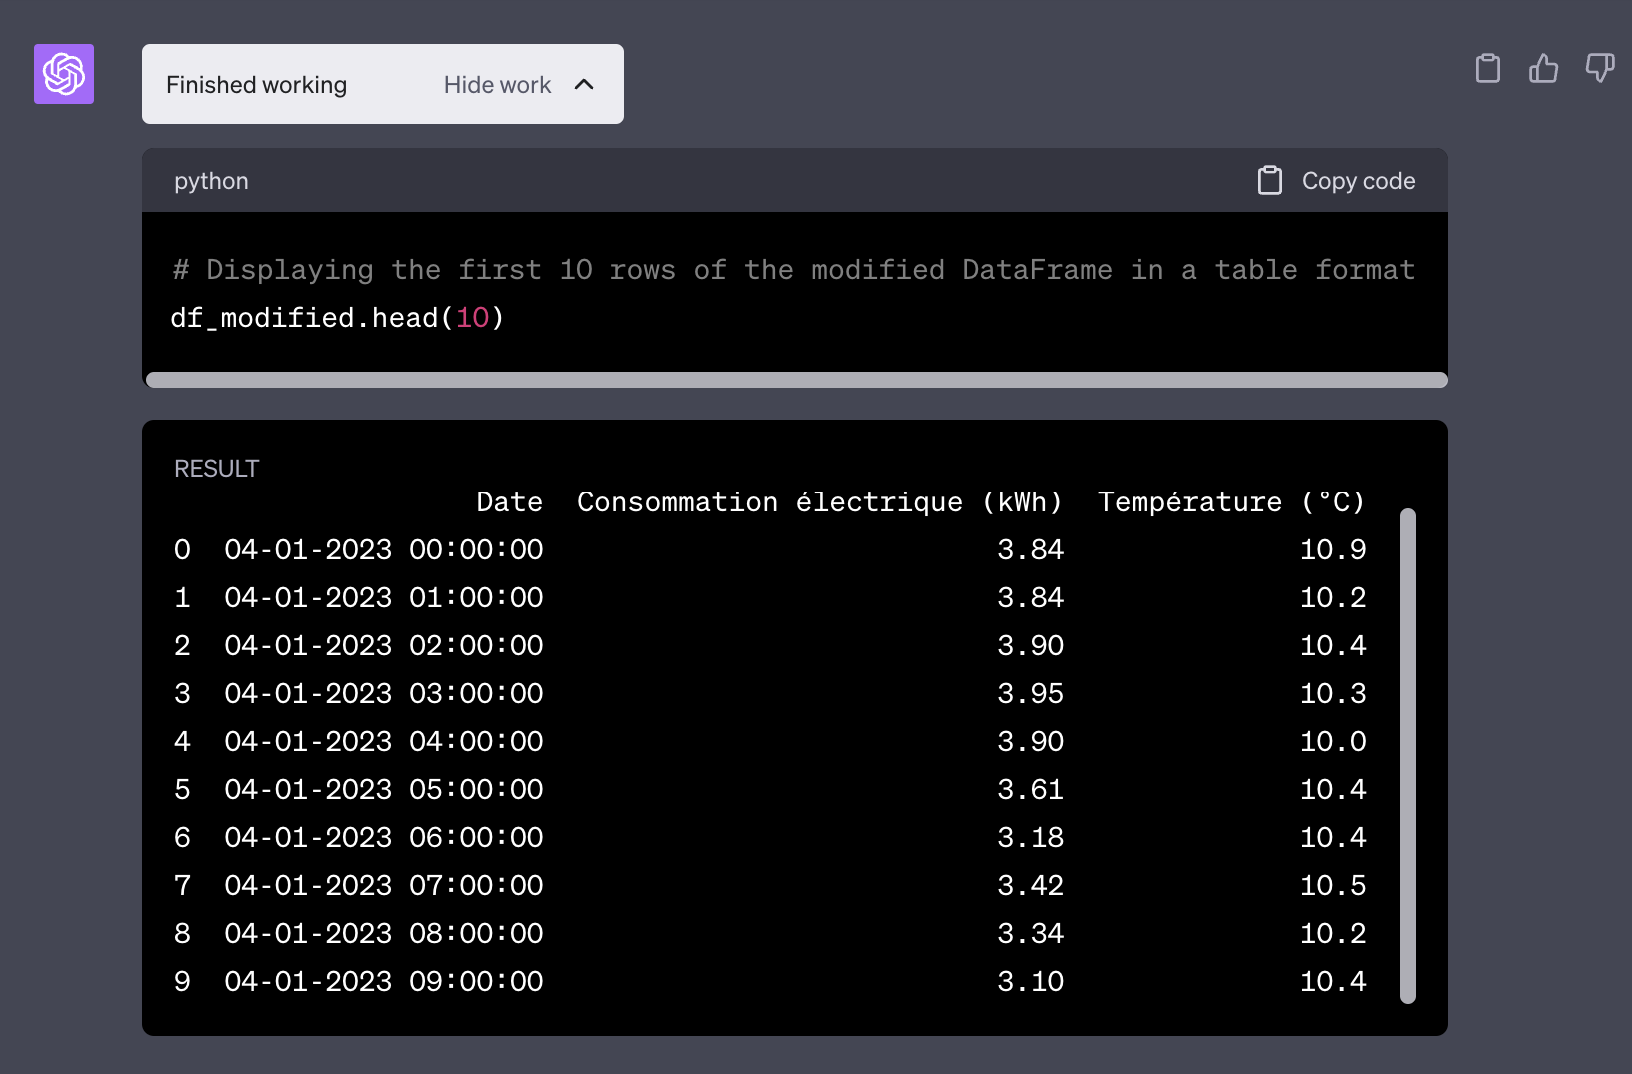
I would like to point out that these transformations were carried out by ChatGPT by following the process described above, in other words by giving it step-by-step instructions on the changes to make.
I did try letting ChatGPT handle the data cleaning on its own, but it often made mistakes or introduced changes that were not relevant.
For now, ChatGPT should therefore be seen as a very capable assistant or executor, rather than a decision-maker. The analysis itself must still be led by you.
B. Our electricity consumption before implementing the measures
Now that our data is ready to be analysed, we need to test our hypothesis regarding the influence of outdoor temperatures on electricity consumption, and quantify that relationship precisely.
To do this, we will calculate the correlation coefficient between outdoor temperature and our electricity consumption.
The goal is to determine to what extent summer heat increases our electricity usage as a result of air-conditioning.
To illustrate this relationship, a chart is needed. In this case, we asked ChatGPT to create a graph showing hourly electricity consumption and temperature over the period from 1 June to 1 July, with two vertical axes, one for temperature and the other for electricity consumption, and one horizontal axis showing the hours of the day.
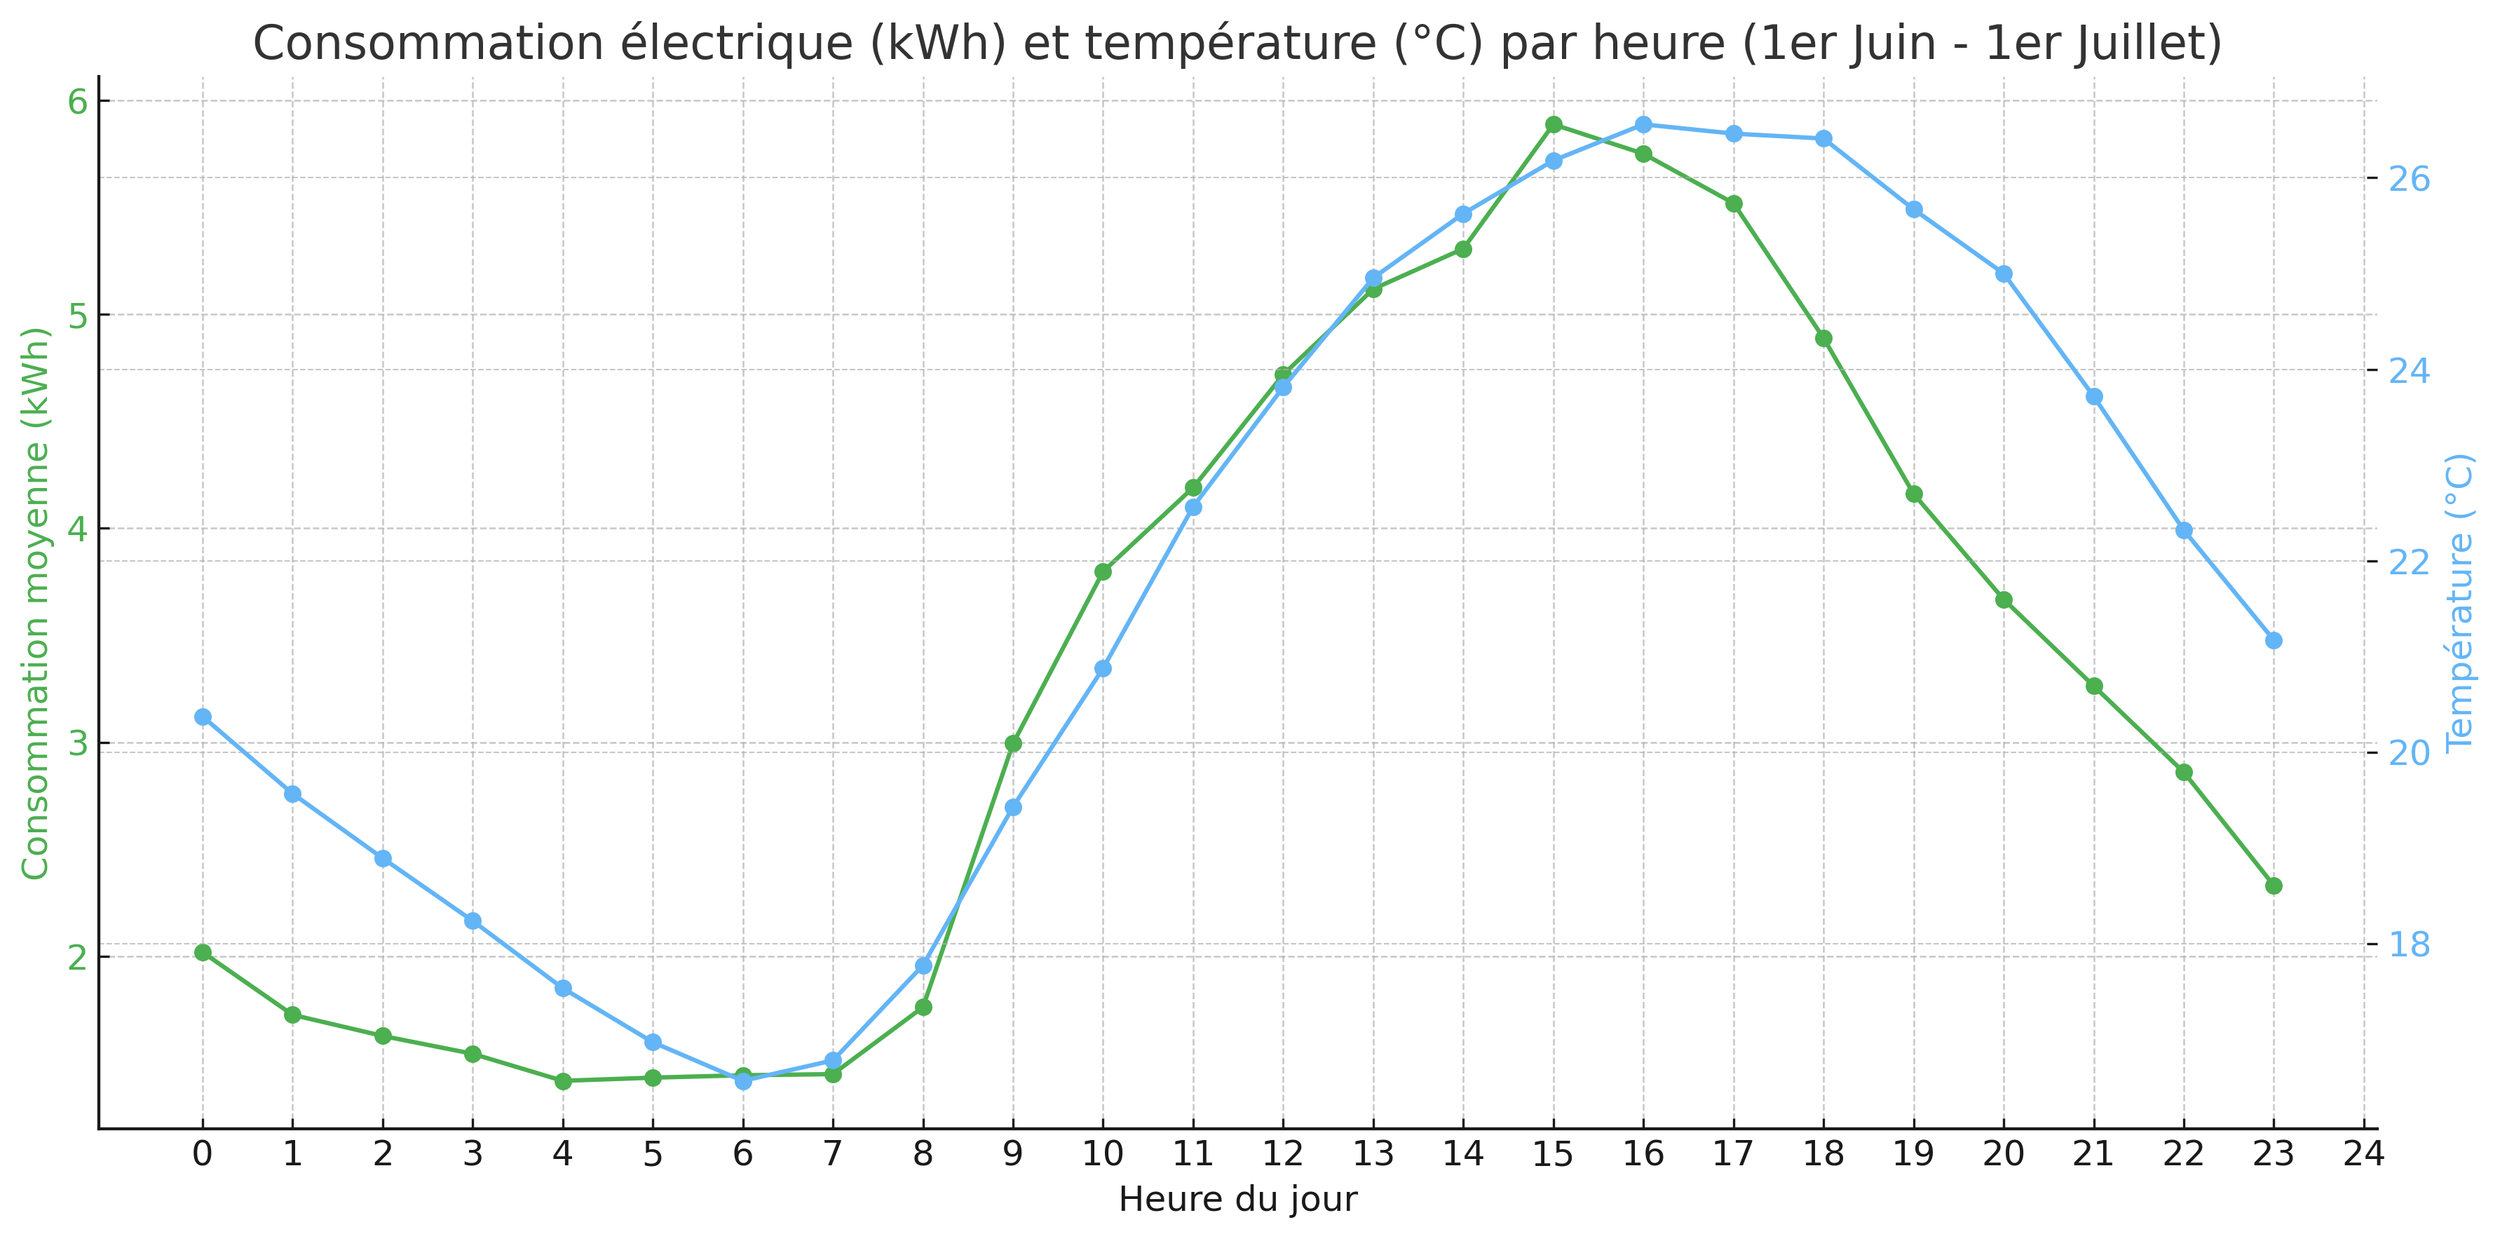
The data collected between 1 June and 1 July therefore shows a very high correlation coefficient of 0.9313, on a scale from 0 to 1, where 1 represents a perfect correlation, between outdoor temperature and electricity consumption.
In other words, the hotter it gets, the more we use the air-conditioning system, and the more electricity we consume. This confirms that air-conditioning is indeed the main factor influencing Greenspace’s electricity consumption during the summer.
A closer examination of the data also shows that electricity consumption, like outdoor temperature, begins to decrease towards the end of the day, at around 5 p.m. However, it only reaches its lowest level at approximately 6 a.m., when the outdoor temperature is at its lowest.
This gives us a window of opportunity between the end of the working day and the following morning, during which electricity consumption should be minimal, since the space is unoccupied.
Finally, this strong correlation confirms that other possible factors, such as attendance levels or the number of devices being used, have only a limited impact on total electricity consumption. We can therefore exclude them from this analysis.
Now, let us compare the coolest day with the hottest day during this period.
We prompted ChatGPT to identify the average temperature between 8 a.m. and 8 p.m., the period during which temperatures generally begin to rise, on both the hottest and the coolest days.
We obtained the following results:
Coolest day, Friday 2 June, average temperature of 17.58°C between 8 a.m. and 8 p.m., maximum temperature of 21.3°C, total electricity consumption of 61.73 kWh.
Hottest day, Friday 9 June, average temperature of 27.47°C between 8 a.m. and 8 p.m., maximum temperature of 30.3°C, total electricity consumption of 108.66 kWh.
Electricity consumption therefore increased by 76.02% between these two days.
This is considerable, particularly since 9 June was far from being an extreme heatwave day.
Of course, a small part of this increase may have resulted from slightly higher attendance on one of the two days. However, based on our experience, Fridays are generally the quietest days at Greenspace, and attendance tends to remain relatively low or moderate during the summer.
It is important to note that, during this period, before we implemented measures to reduce electricity consumption, the air-conditioning system was set to reach a target temperature of between 23°C and 25°C. Our users also tended to adjust the settings themselves.
Once the target temperature had been reached, the air-conditioning continued operating in order to maintain it.
In addition, the fans built into the air-conditioning system ran continuously, although they were set to their lowest speed, level 1 out of 3.
2. Time to take action!
Now that we have confirmed that higher outdoor temperatures are associated with a significant increase in electricity consumption, we need to identify settings that can reduce air-conditioning usage while preserving the comfort of our users.
A. Programming the air-conditioning system
Over a period of almost three weeks, we tested different combinations of settings in order to maximise energy savings while taking user feedback into account.
After making several adjustments and collecting feedback from our coworkers, we found the right balance and adopted the following schedule, which was introduced on 20 July 2023:
For the Patio area, the target temperature was set at 25°C, with the air-conditioning completely switched off between 8 p.m. and 8 a.m.
For the Terrace area, the target temperature was set at 25°C, with the air-conditioning completely switched off between 9 p.m. and 8 a.m. The system is switched off later in this area because it is located higher up and is therefore more sensitive to heat.
For the Garden area, the target temperature was set at 26°C, with the air-conditioning completely switched off between 8 p.m. and 8 a.m. The target temperature is slightly higher because some users in this area had complained that it was too cold.
It is also worth noting that users can no longer change the settings themselves. We now keep the remote control safely in our office.
Once the air-conditioning system reaches the target temperature, it switches off and only starts operating again when the temperature rises.
B. Overview of the changes
Let us compare Wattspirit electricity consumption data from two days with similar average temperatures, one before the new programming was introduced and one afterwards, in order to observe the impact on the electricity consumption curve.
Friday 9 June, average temperature of 27.47°C between 8 a.m. and 8 p.m., maximum temperature of 30.3°C, reached at 5 p.m.
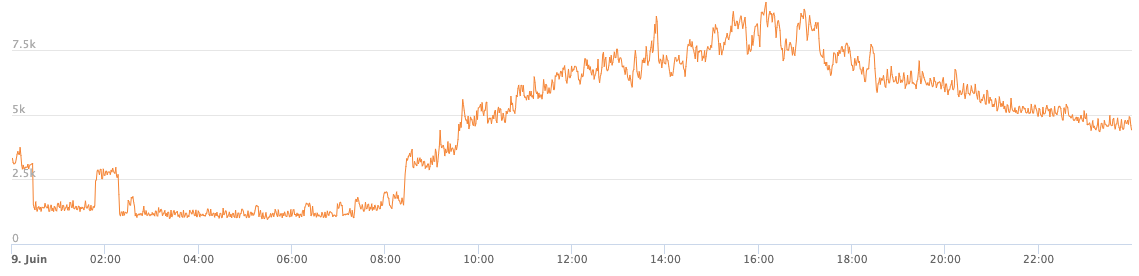
- Friday 22 August, average temperature of 27.18°C between 8 a.m. and 8 p.m., maximum temperature of 30.6°C, reached at 4 p.m.

3 - Surprising results!
Let us now move on to analysing the results.
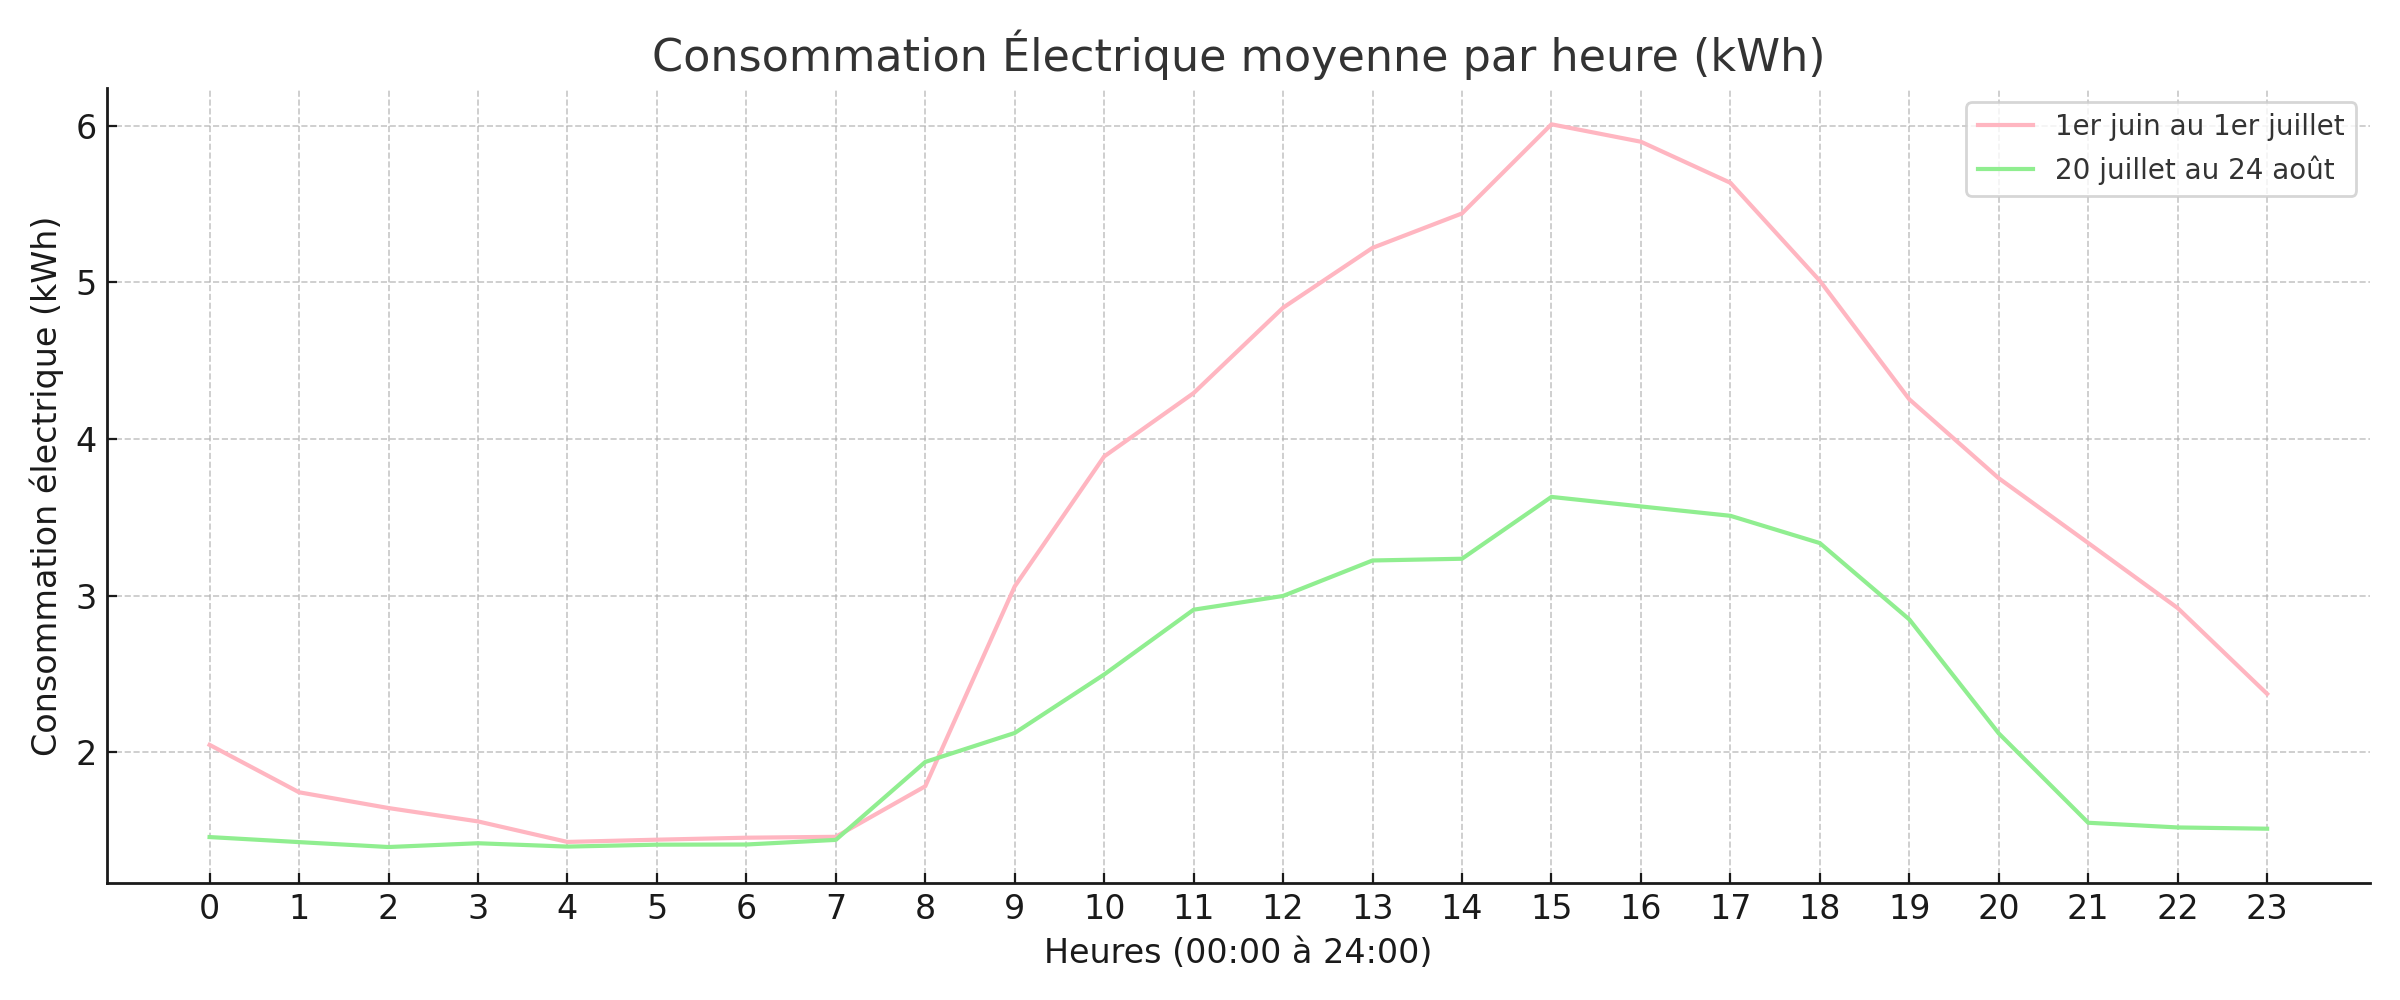
- Période du 1er juin au 1er juillet : 80,47 kWh
- Période du 20 juillet au 24 août : 53,86 kWh
With more than one month of data, covering 34 days, we have enough data points to compare the period from 1 June to 1 July with the period from 20 July to 24 August.
Les résultats sont sans appel ! Entre les deux périodes, on note une réduction de notre consommation d’énergie moyenne de 33,06% ! C’est considérable (et bien au-delà de mes attentes, je dois dire). Cependant, il nous faut tempérer ces résultats et les creuser davantage. Nous allons maintenant comparer les deux périodes uniquement sur les jours où la température moyenne, entre 08:00 et 20:00, a été supérieure à 25°C → L’objectif est de mesurer l’impact précis de notre programmation de la climatisation.
Let us begin with an overall comparison of these two periods, without applying any specific temperature filter.
Period from 20 July to 24 August, 53.86 kWhPeriod from 1 June to 1 July, 80.47 kWh
This time, the gap between the two curves has narrowed considerably, indicating a smaller difference in average electricity consumption between the two periods.

Nevertheless, this still represents an average energy saving of 20.67% between the two periods.
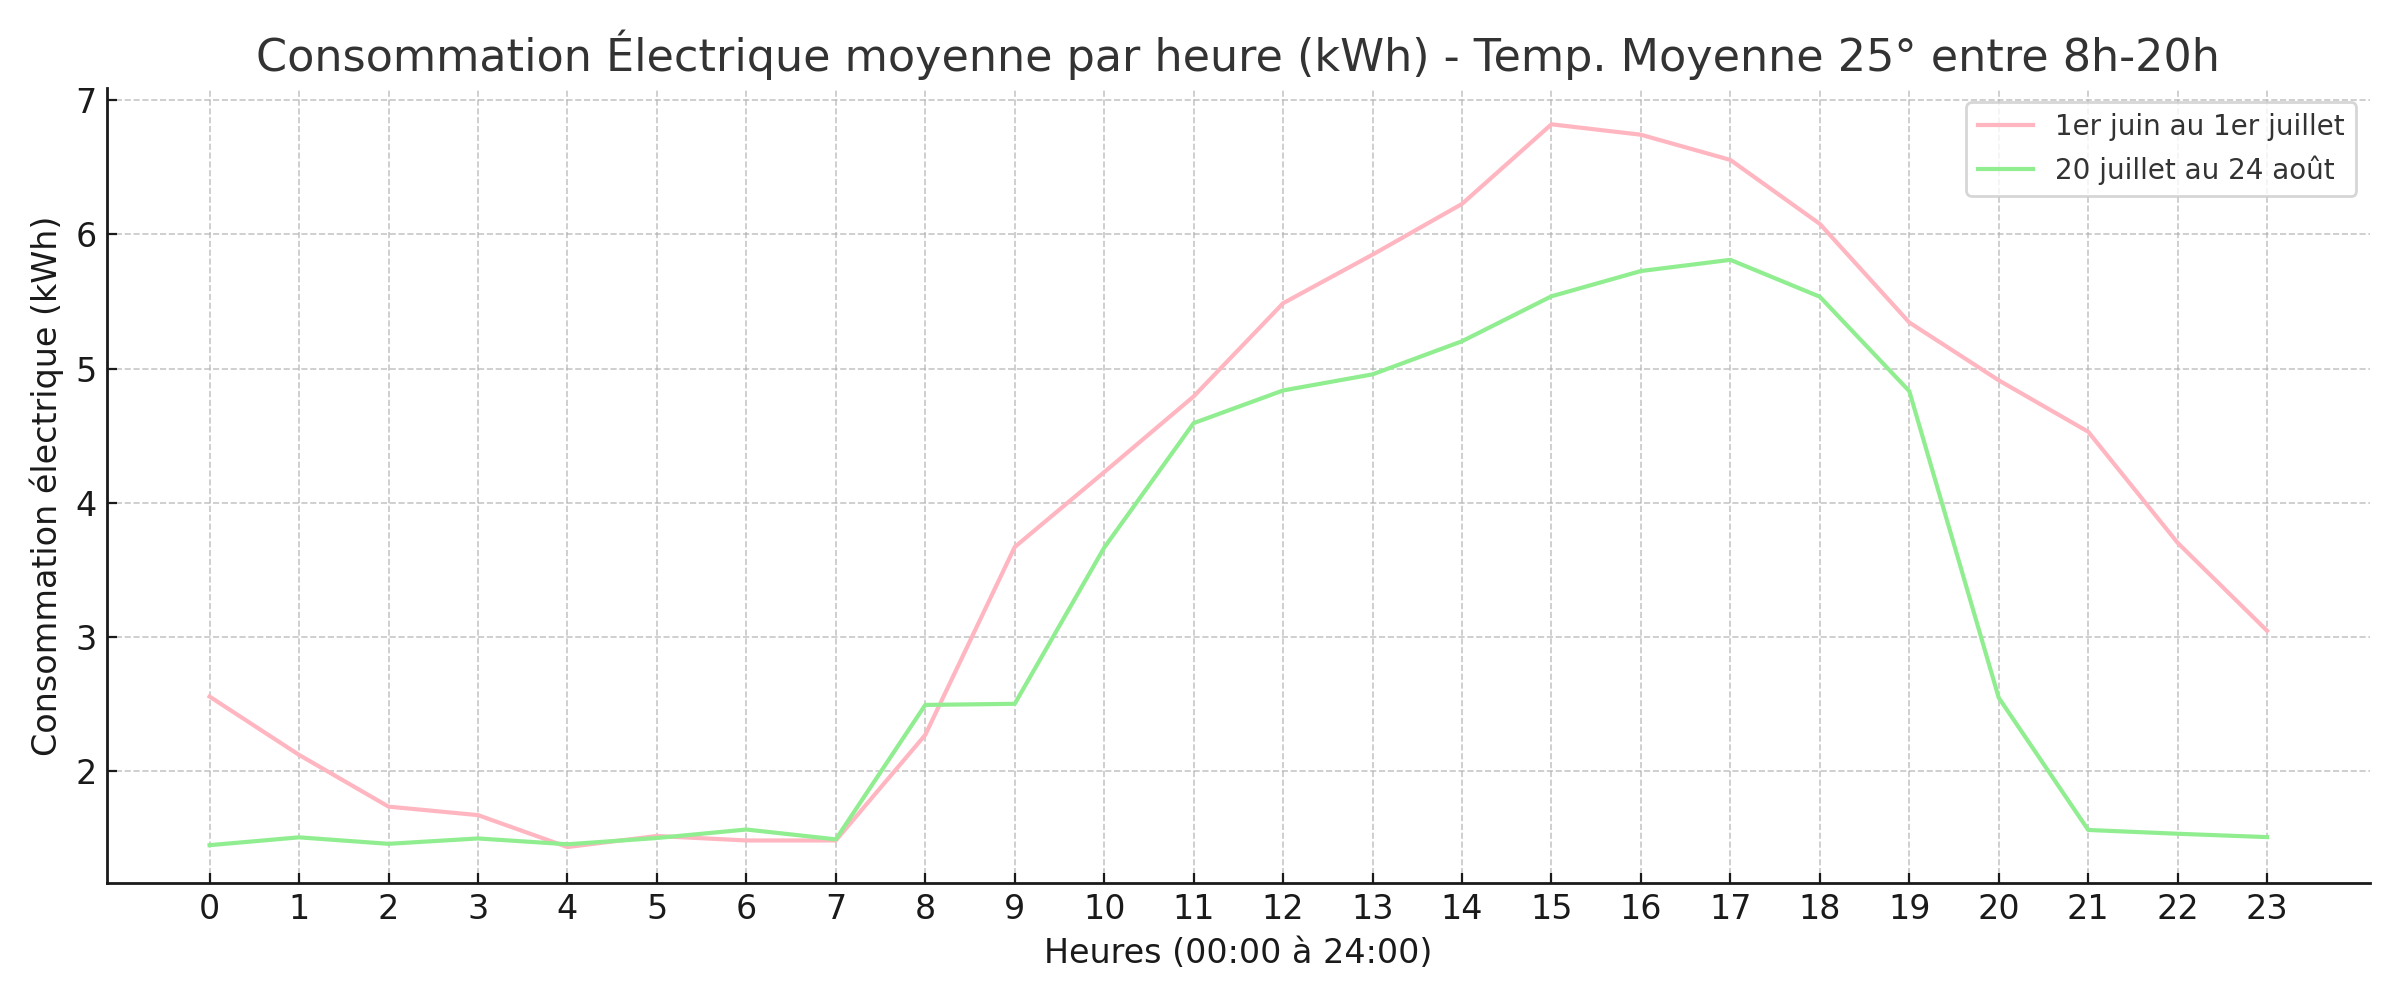
Finally, let us examine the results for the four hottest days in each period.

Period from 20 July to 24 August, 77.32 kWhPeriod from 1 June to 1 July, 102.16 kWh
Download the CSV file, electricity consumption and temperature data
After excluding 17 August, which was not warm enough, and 25 June 2023, which was excessively hot, we obtained an average temperature between 8 a.m. and 8 p.m. of 27.08°C for the period from 1 June to 1 July, and 26.98°C for the period from 20 July to 24 August.
As these two values are very close, we can make a reliable comparison of the results.
A special mention goes to ChatGPT and its excellent ability to generate charts from very little context in each prompt.
After asking it to create the first visualisation as a line chart with two curves, I only had to specify the filters to apply to the data in order to generate the following charts.
Drum roll, please...Across the four hottest days in each period, excluding 25 June and 17 August, we achieved a 24.32% reduction in electricity consumption. Not bad, right?
However, it is important to emphasise once again that, although these results appear precise, they only provide an approximate indication of the savings directly attributable to the new air-conditioning schedule.
As briefly mentioned earlier, the analysis does not account for other factors, including changes in attendance and therefore the number of electrical devices being used from one day or period to another.
Including these additional variables, provided that the necessary data had been available at the time of the analysis, would probably have produced slightly different results. However, the difference would likely have remained limited given the relatively low attendance levels during the summer.
Now, let us take a step back and draw a few lessons from this data analysis project.
I therefore deliberately chose to focus solely on the relationship between outdoor temperature and electricity consumption in order to avoid making the analysis unnecessarily complex.
Nevertheless, it seems clear that our actions were successful and had a significant positive impact on reducing our electricity consumption.
At Greenspace, another step towards greater energy efficiency
As the planet continues to warm and summer temperatures rise year after year, the benefits of these measures are likely to become even greater in the summers ahead.
What about you? Are you ready to start using Advanced Data Analysis?
In any case, both personally and as part of the Greenspace team, we will continue using ChatGPT and its Advanced Data Analysis capabilities in the future, and we look forward to seeing how these tools evolve.
With winter approaching, we will carry out the same analysis again, this time with the aim of reducing the electricity used for heating. We now have the tools and methodology required to perform this type of assessment quickly and efficiently.
Of course, analysing electricity consumption is only the beginning. We also plan to assess water consumption, attendance levels within our coworking space and the use of consumable supplies.
It should therefore be used with care, and the consistency of its results should always be checked. I had to do this several times during the course of this analysis.
The aim is to develop appropriate strategies to measure and reduce our carbon footprint as much as possible, while continuing to provide our users with the best possible service.
Even with advanced knowledge of data science, it is important to remember that ChatGPT has limitations inherent to the way it operates. It can produce inaccurate information or follow an instruction too literally without fully understanding its wider meaning.
We would probably not have achieved the same results, or perhaps any useful results at all, had we allowed ChatGPT to conduct the analysis independently, without guidance.
These analyses are now accessible to us, and to you too.
It was by guiding ChatGPT with precise instructions and a clear analytical process that we were able to obtain genuinely useful insights.
On the one hand, collecting data has become much easier thanks to the rapid development of the Internet of Things. Sensors and connected devices can now measure our behaviours and usage patterns with a high level of precision, and are available at relatively affordable prices both online and in shops.
To make the most of ChatGPT, Advanced Data Analysis, or any other LLM, a basic understanding of data analysis and data visualisation therefore appears to be an important prerequisite.
On the other hand, the rise of large language models, or LLMs, such as GPT-4 and Claude 2 means that almost anyone, including people with no previous experience in data analysis, can begin using the data collected by these devices.
It is now widely recognised that the quality of the output produced by language models such as ChatGPT depends heavily on the quality of the input prompt.
With only a few prompts, users can start interpreting the data, extracting meaningful insights and making better-informed decisions.
Advanced Data Analysis, making data science accessible to everyone?
Let us return briefly to OpenAI’s Advanced Data Analysis feature, which we used throughout this project.
OpenAI’s tool proved extremely effective at transforming raw data, in our case temperature and electricity consumption data stored in CSV files, analysing it, and producing the charts and statistical results that allowed us to assess the initial situation and evaluate the effectiveness of the measures introduced to reduce electricity consumption.
All of this was completed in only a few minutes.
Advanced Data Analysis therefore gives people with little experience in data analysis or programming the opportunity to work with data without requiring advanced technical knowledge.
This increased accessibility is already enabling individuals and professionals to analyse large datasets, develop software, websites and applications, and automate a wide range of tasks that were previously reserved for a relatively small number of qualified technical specialists.
However, the capabilities of these tools should still be viewed with some caution.
Their power and ease of use are undeniable. Nevertheless, OpenAI’s tool was only able to demonstrate its full value because we knew exactly what we wanted it to produce, and how to guide it towards that result.
It is now widely recognised that the quality of the output produced by language models such as ChatGPT depends heavily on the quality of the input prompt.
To make the most of ChatGPT, Advanced Data Analysis, or any other LLM, a basic understanding of data analysis and data visualisation therefore appears to be an important prerequisite.
It was by guiding ChatGPT with precise instructions and a clear analytical process that we were able to obtain genuinely useful insights.
We would probably not have achieved the same results, or perhaps any useful results at all, had we allowed ChatGPT to conduct the analysis independently, without guidance.
Even with advanced knowledge of data science, it is important to remember that ChatGPT has limitations inherent to the way it operates. It can produce inaccurate information or follow an instruction too literally without fully understanding its wider meaning.
It should therefore be used with care, and the consistency of its results should always be checked. I had to do this several times during the course of this analysis.
In any case, both personally and as part of the Greenspace team, we will continue using ChatGPT and its Advanced Data Analysis capabilities in the future, and we look forward to seeing how these tools evolve.
What about you? Are you ready to start using Advanced Data Analysis?
Scott S., Greenspace Team